📈 ANALYTICS · NO SQL REQUIRED
Analytics & dashboards
Turn a database into a dashboard without writing a line of SQL. DataDock's chart builder lets you pick a dataset, a measure and a dimension — and it writes the correct per-engine SQL for you.
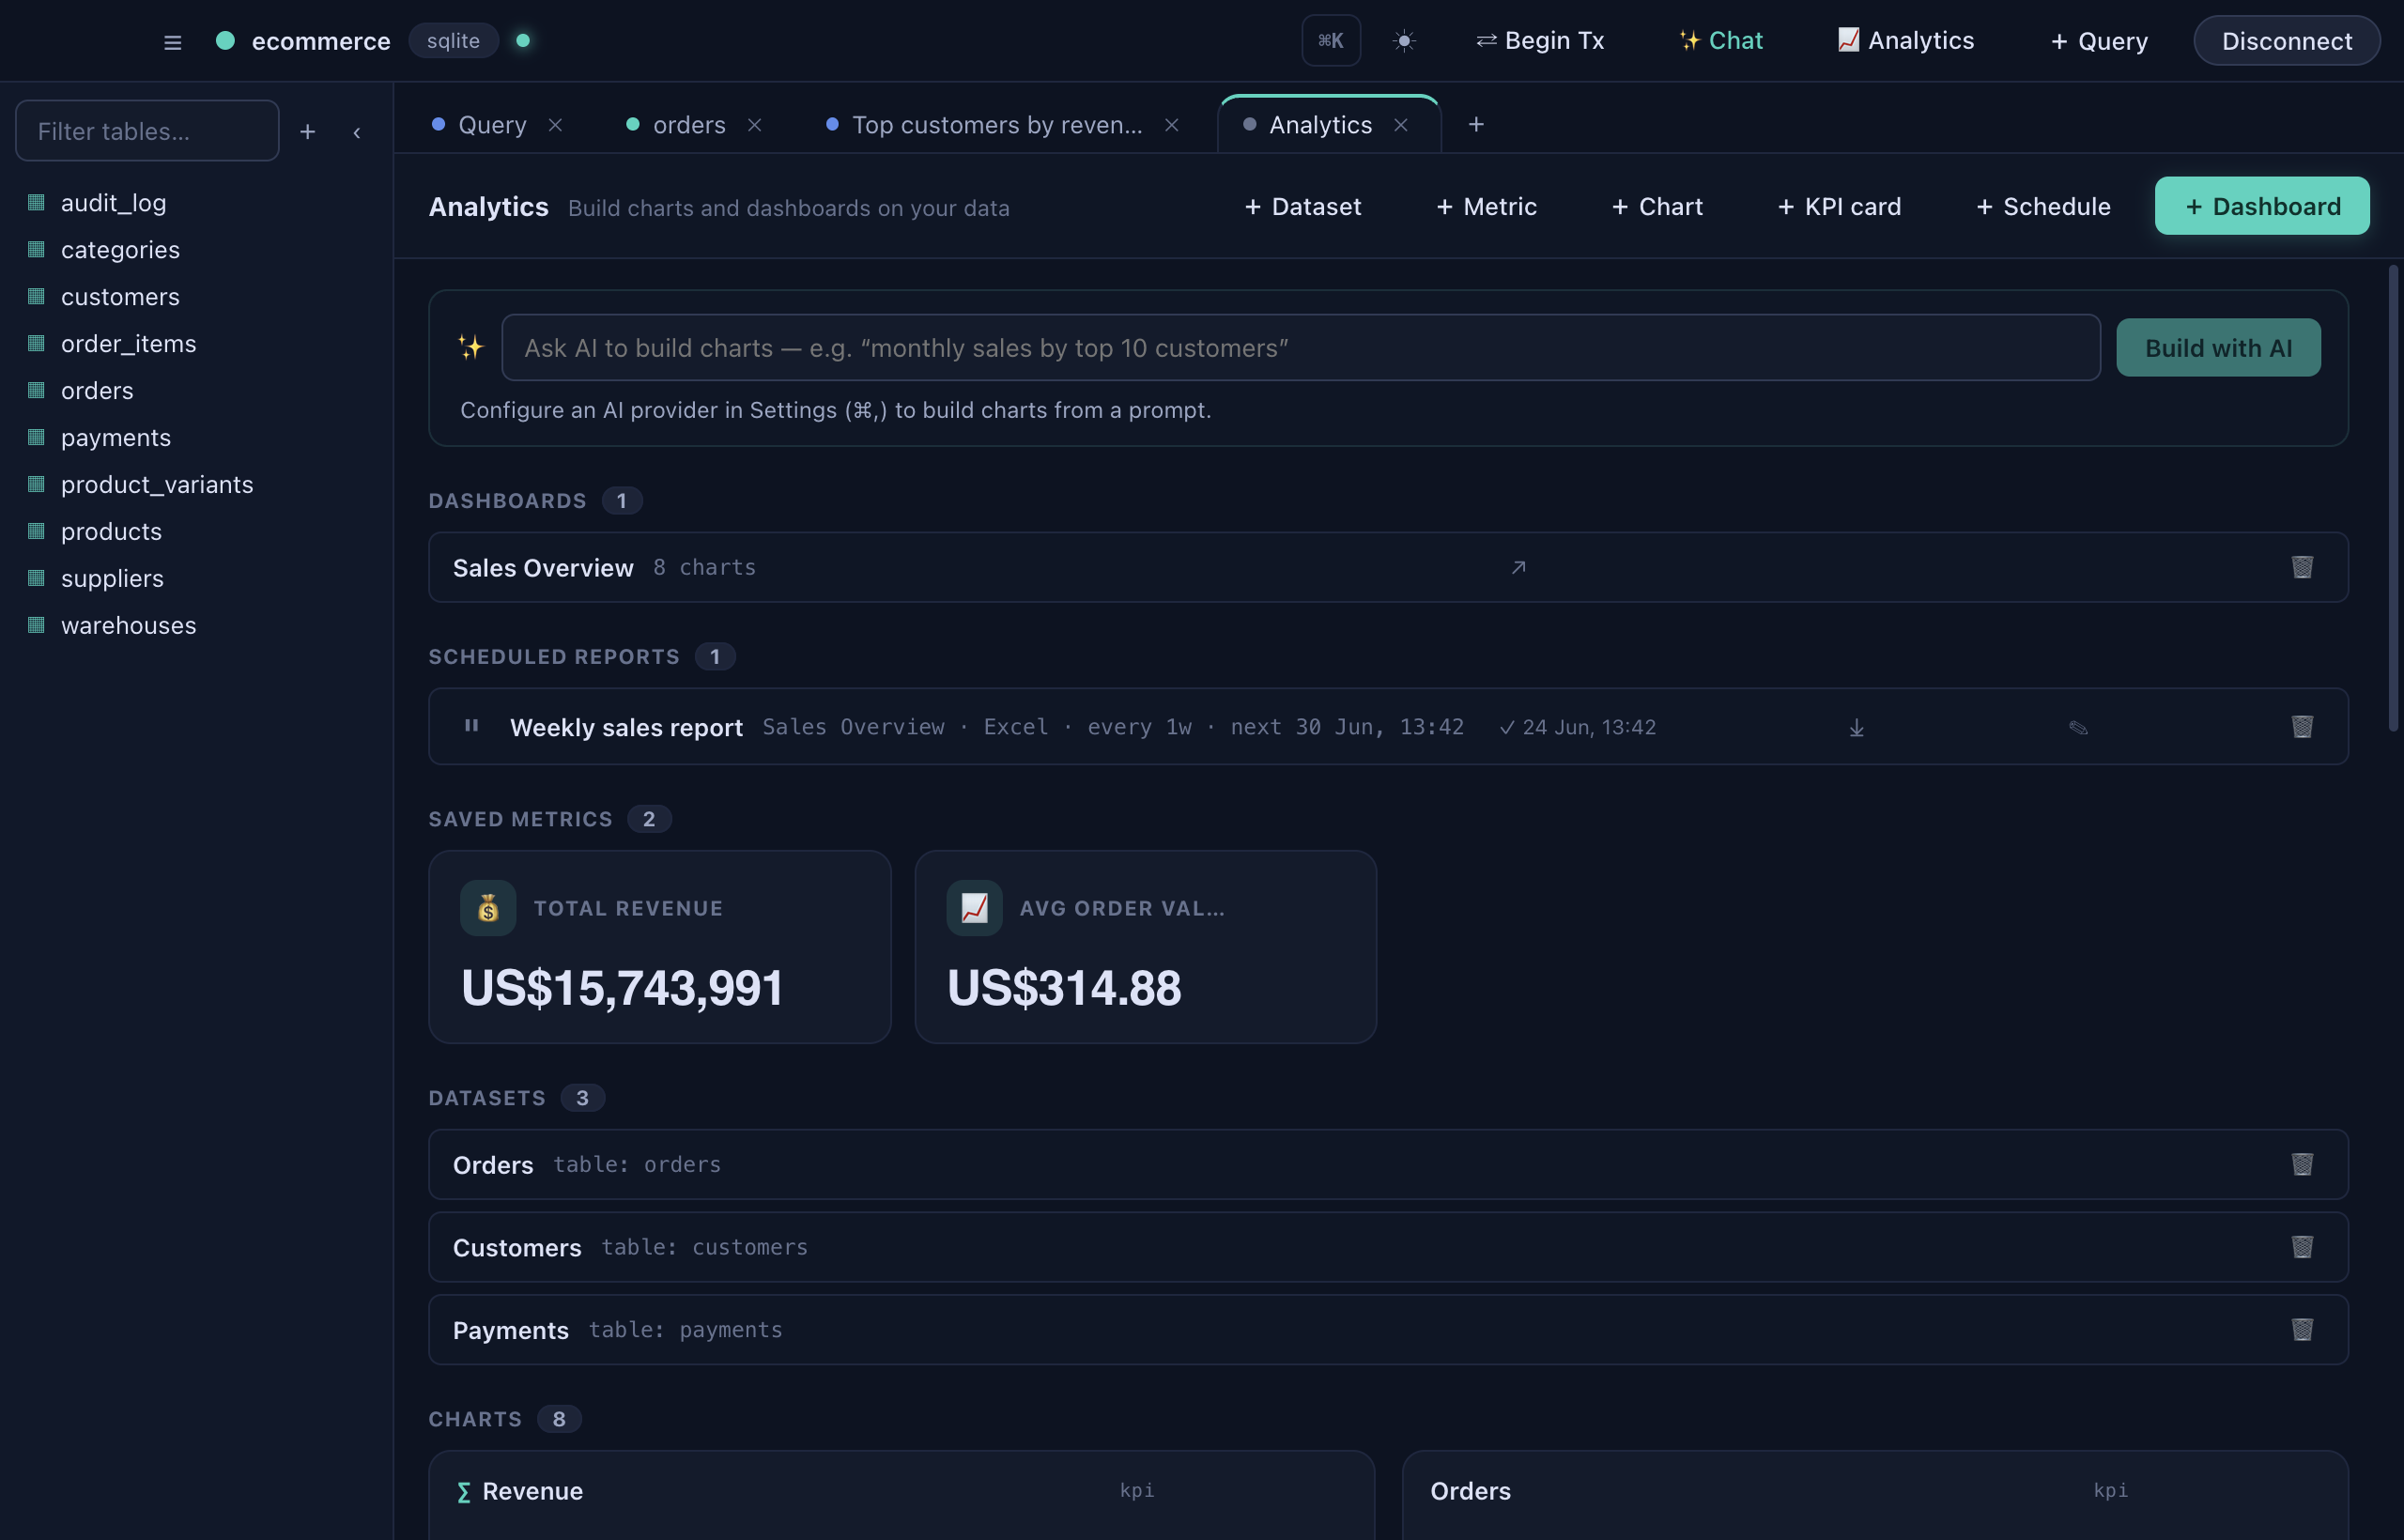
Build a chart
- Pick a dataset — a table, a saved query or an existing view.
- Choose a measure — what to aggregate (e.g.
SUM(amount),COUNT(*)). - Choose a dimension — how to group it (e.g. by month, by category).
- Pick a visualization — bar, line, pie/donut, a KPI card, a pivot, or save it as a reusable metric.
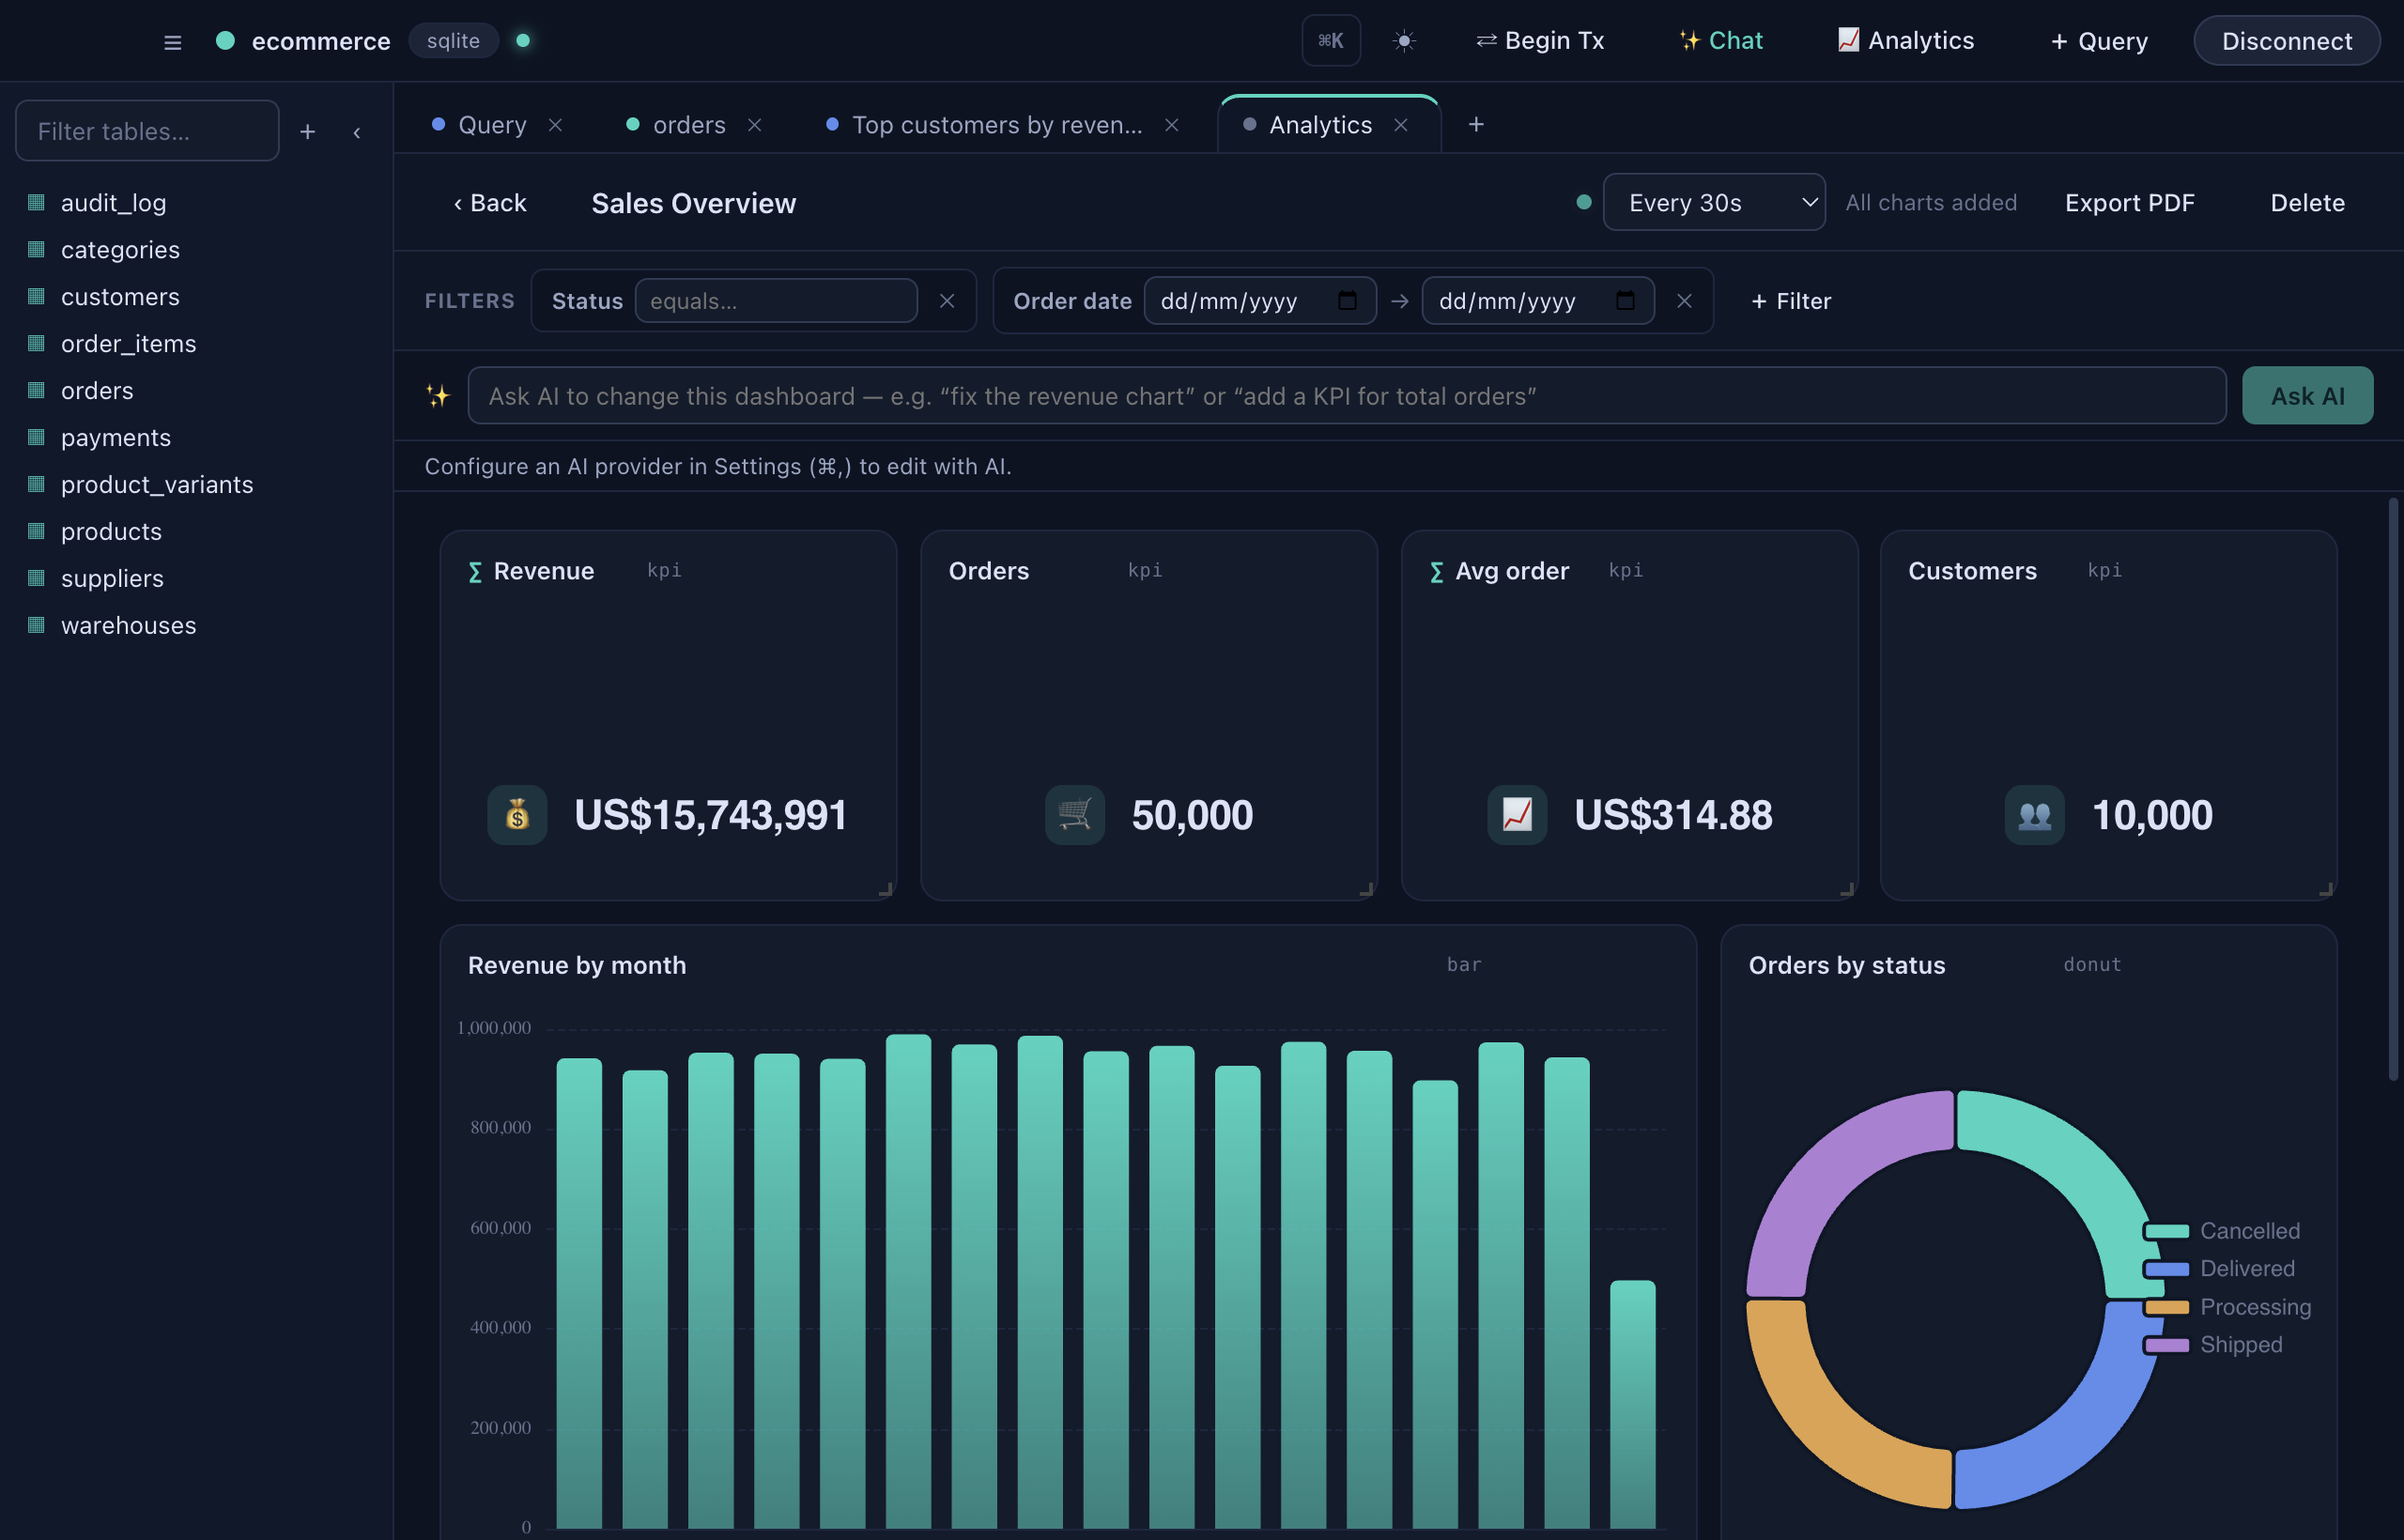
Compose a dashboard
- Drag and drop widgets onto a resizable 12-column grid.
- Add filters (date range, status, region) that apply across every widget at once.
- Turn on realtime refresh so a board updates on an interval (e.g. every 30s).
- Drill through any chart to the underlying rows.
- Or just ask the AI — "build a sales overview dashboard" — and it assembles the widgets, then edits them in place on request.
Scheduled PDF reports
Once a dashboard exists, DataDock can auto-export it on a schedule — so the weekly report writes itself.
- Set a cadence — hourly, daily, weekly or custom.
- DataDock renders the whole dashboard to a clean, paginated PDF (or Excel), with the live filter values baked in.
- The file is saved to a folder you choose — e.g.
~/Reports. - You get a desktop notification on every run.
Weekly
Every Monday · 08:00 → PDF saved to ~/Reports
✓ Last sent Jun 23