Tools & utilities
Replication topology monitor
Group connections into a named replication set, give each node a role — primary, replica or arbiter — and watch the whole set live from one screen. Create one from the Topologies section in the sidebar; it opens as a full-window monitor.
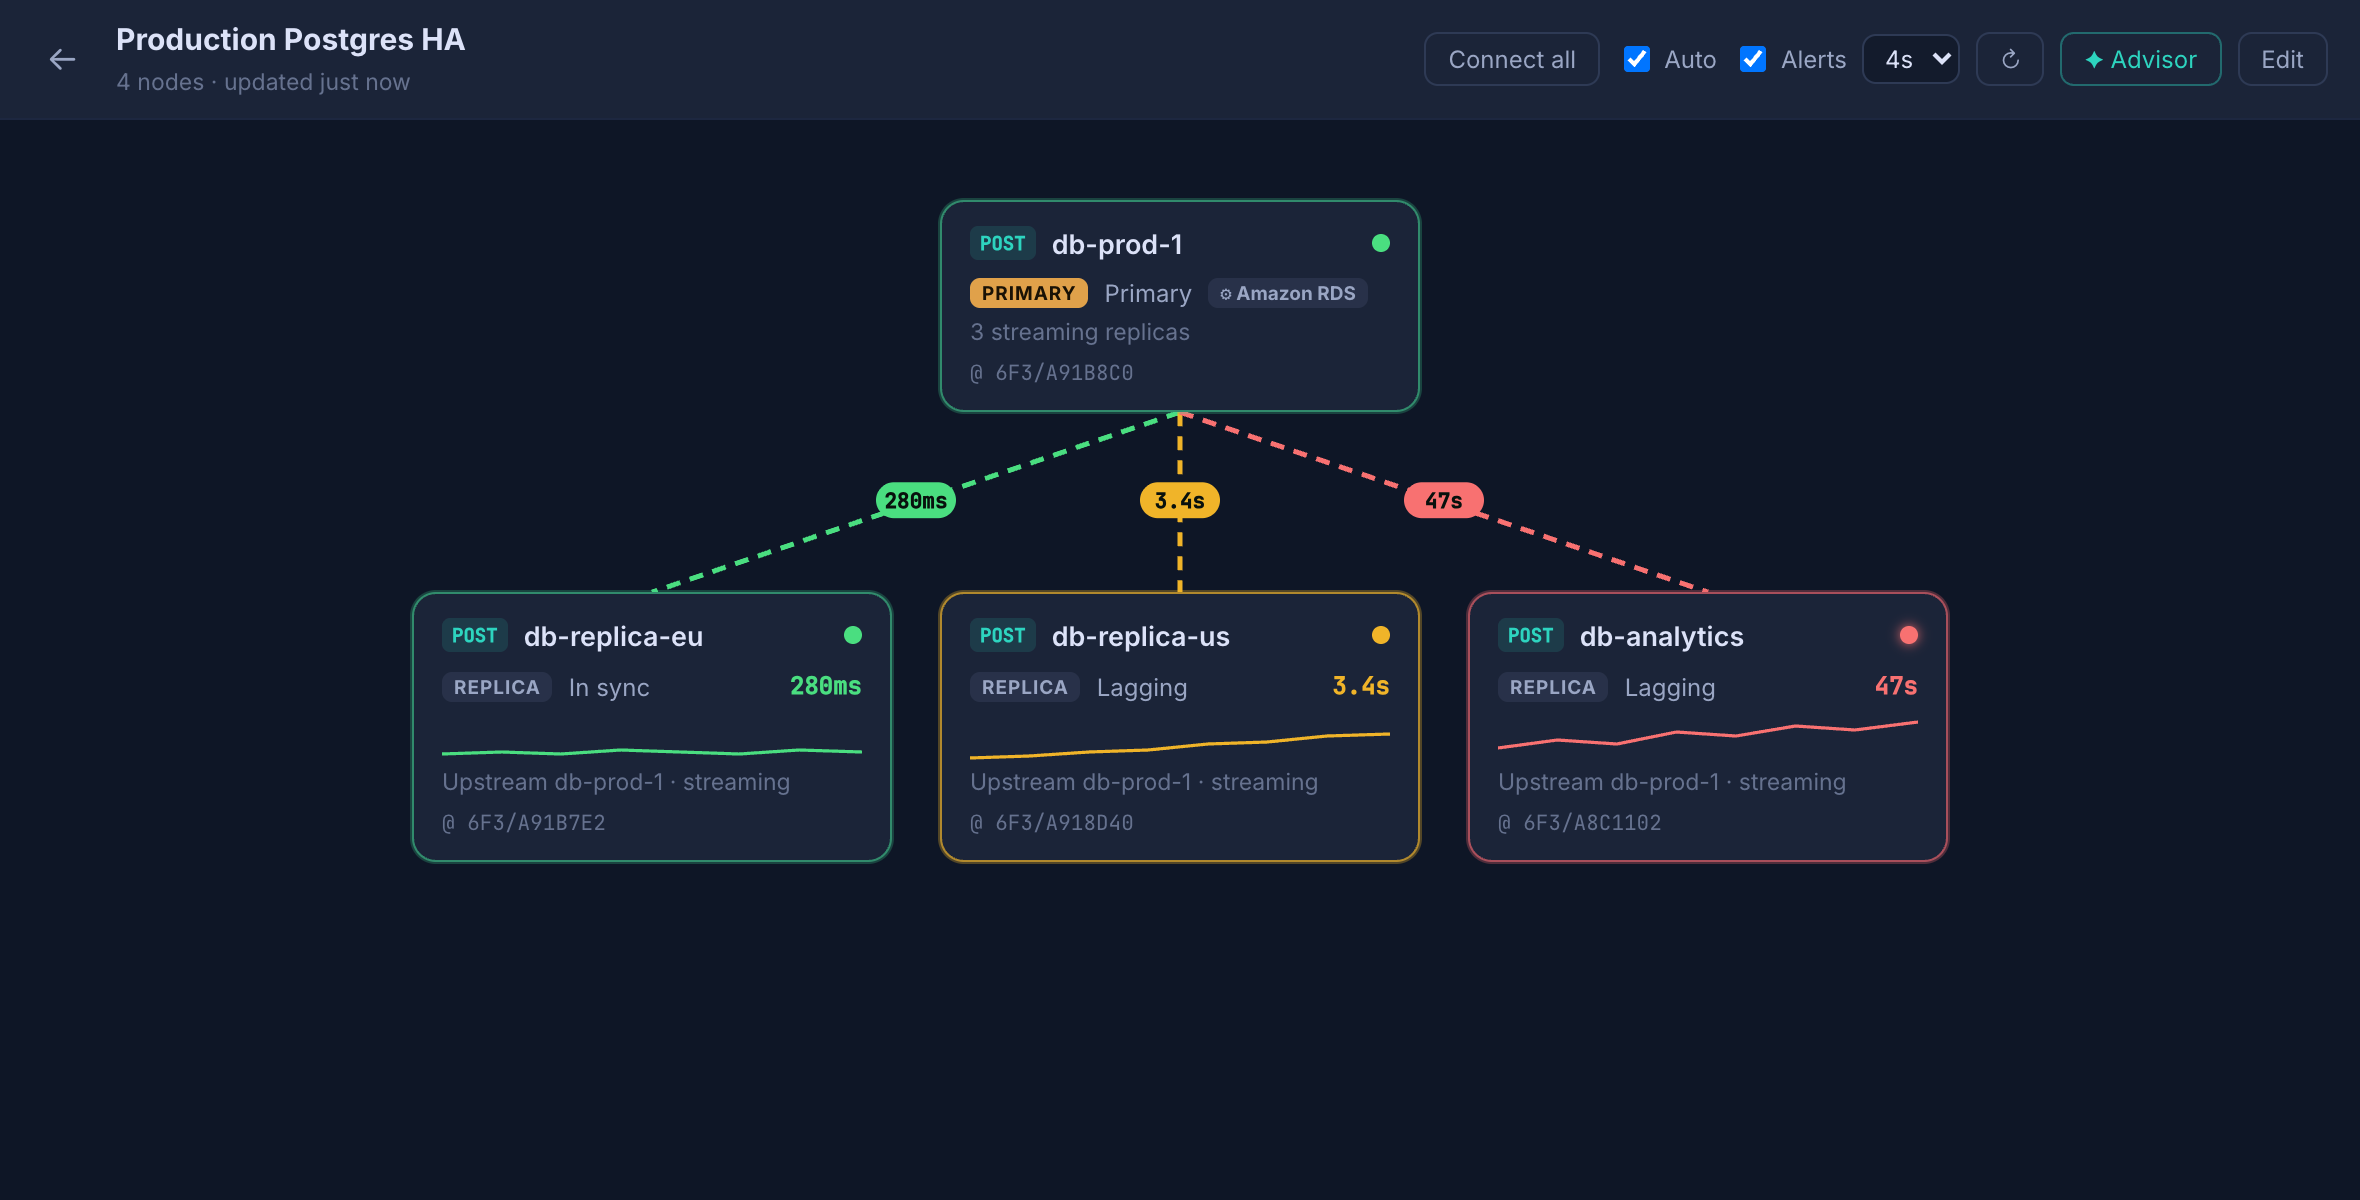
- Live topology view — primary on top, replicas below, joined by animated links coloured by lag (green / amber / red against thresholds you set) with a health dot on every node.
- Lag trend sparklines — each replica card draws a rolling history of its lag, so you can see at a glance whether it's holding steady or drifting — not just the instantaneous number.
- Threshold alerts — opt-in desktop notifications fire the moment a node goes unreachable or its lag turns critical, so you don't have to keep the panel in view.
- Per-engine status, normalized — DataDock reads each node's own replication view: PostgreSQL (
pg_stat_replication/ replay LSN), MySQL (SHOW REPLICA STATUS), MongoDB (replSetGetStatusoptime lag) and Redis (INFO replication). - Managed-cluster aware — nodes running on a managed/orchestrated platform (Amazon RDS / Aurora, MongoDB Atlas, repmgr, MySQL Group Replication) are detected and badged.
- Honest about reality — nodes you lack privilege on (e.g. missing
pg_monitor/REPLICATION CLIENT) show a clear “no status” state instead of a fake green, and a node whose engine-reported role differs from the one you assigned gets a warning. - Auto-refreshing (2 s – 30 s, pausable) with Connect all to bring the set online, and click any node to jump straight into its full workspace.
- ✦ AI advisor — one click hands the live snapshot to your configured AI provider, which explains what's wrong, the likely cause and the exact advisory commands to investigate. It diagnoses; you decide and run — and it won't suggest manual failover on a managed cluster.
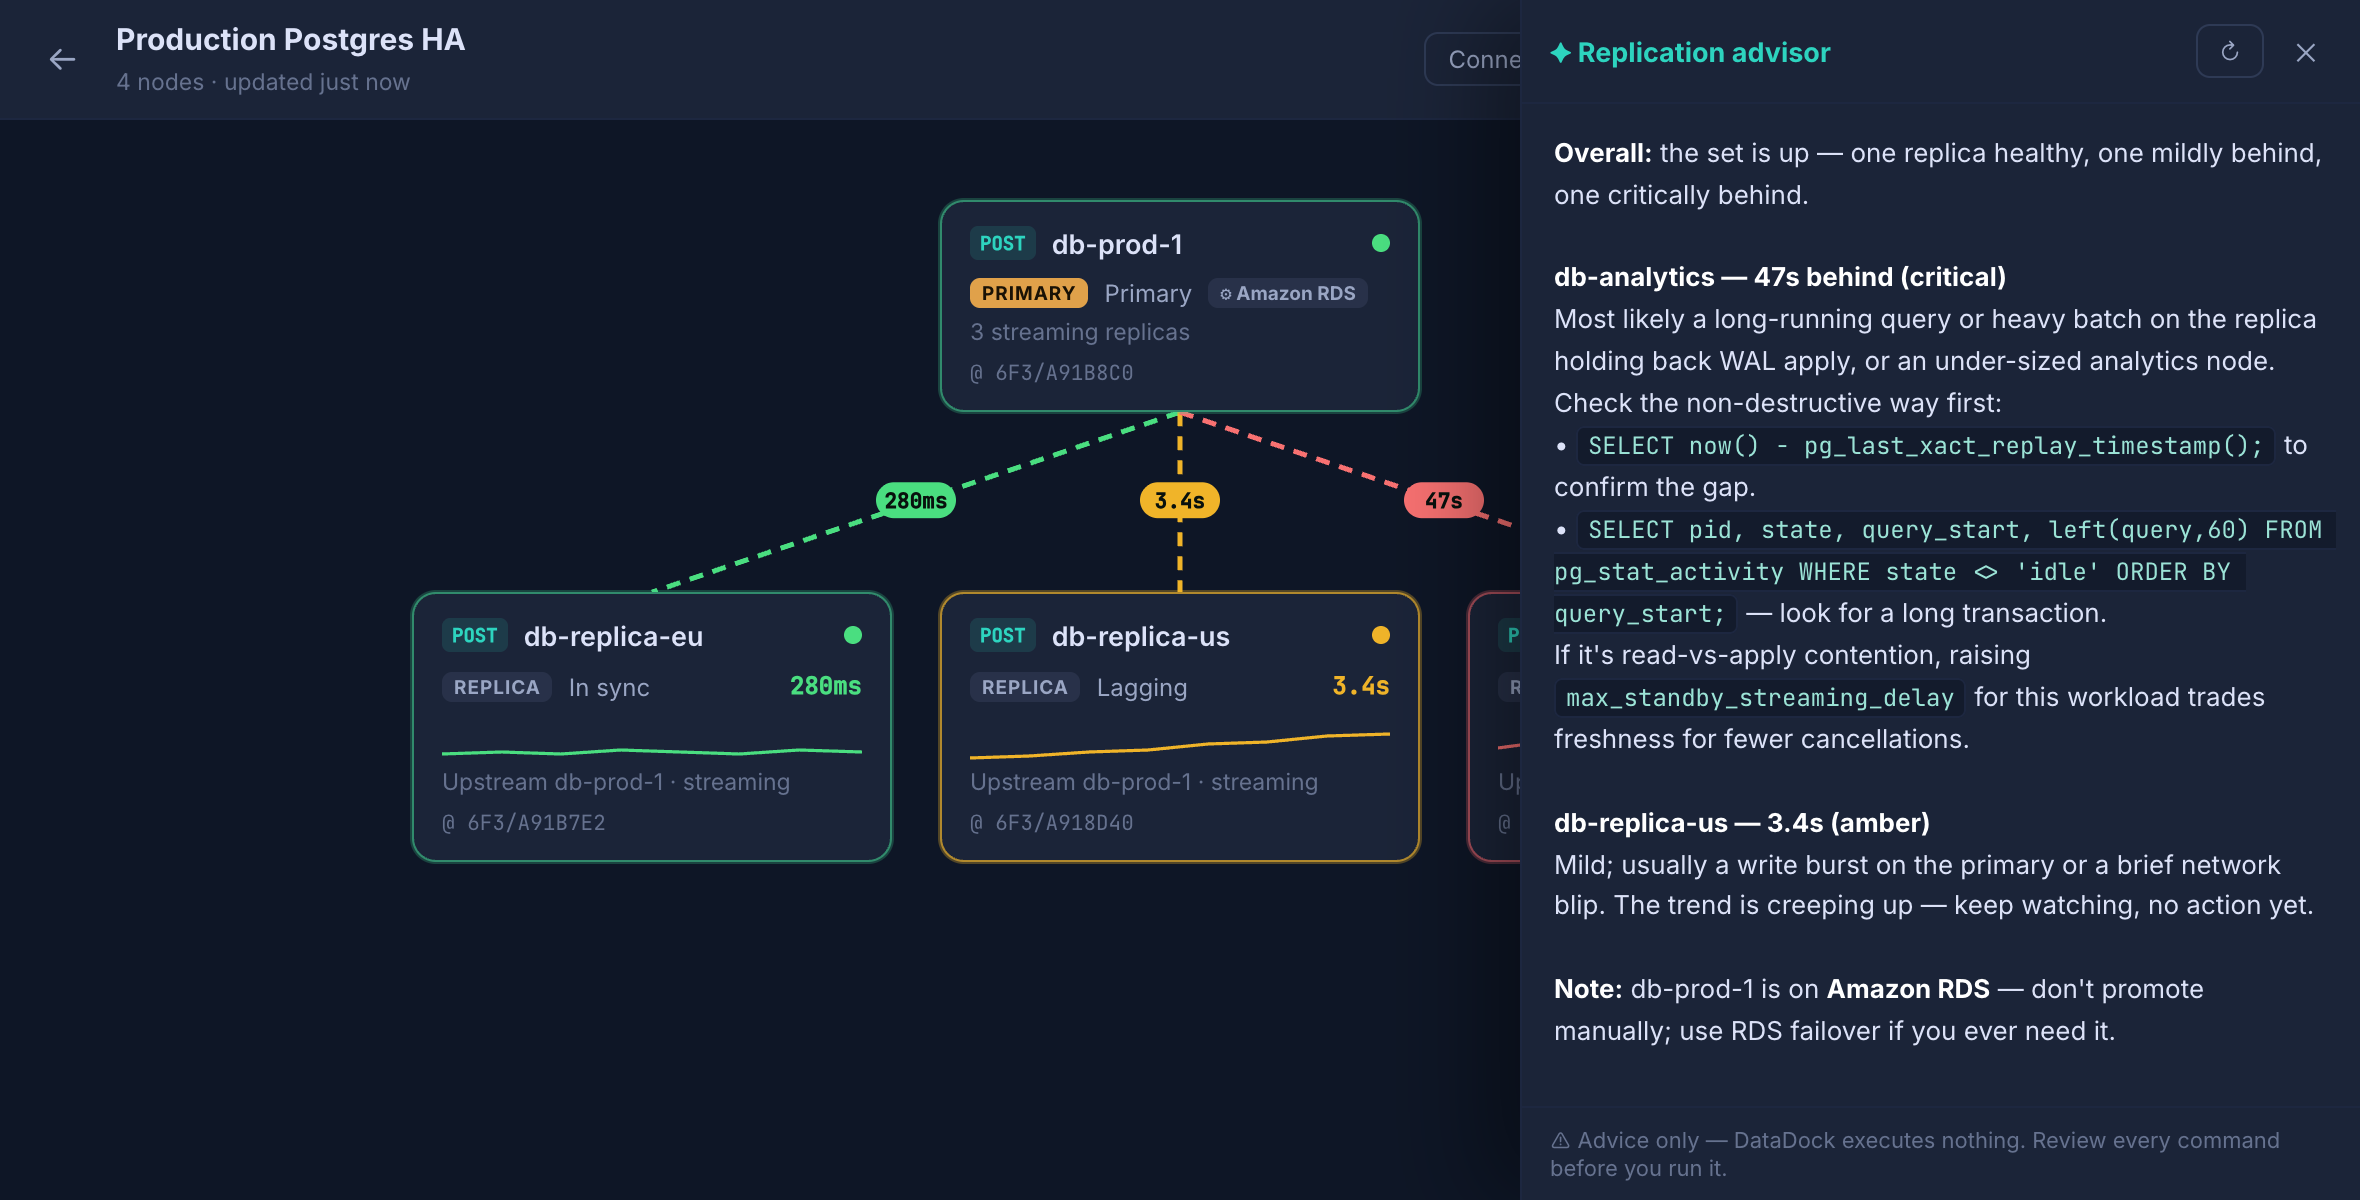
The whole feature is read-only by design — DataDock monitors and advises, but executes nothing and has no promote/failover buttons, since issuing those directly would fight cluster orchestrators like Patroni or RDS. The goal is to see and understand your topology clearly and safely.
Redis & live queues
DataDock treats Redis as a first-class engine. Browse keys grouped by prefix, inspect every value type (strings, hashes, lists, sets, sorted sets, streams), and run raw commands.
If you run background jobs on Redis, the live queue dashboard shows them moving in realtime — pending, active, delayed and failed counts per queue, plus server stats (memory, clients, ops/sec, hit-rate, keys, uptime). DataDock auto-detects the framework you use:
Laravel / HorizonBullMQSidekiqRQCelery
Import & export
Move data in and out in whatever shape you need.
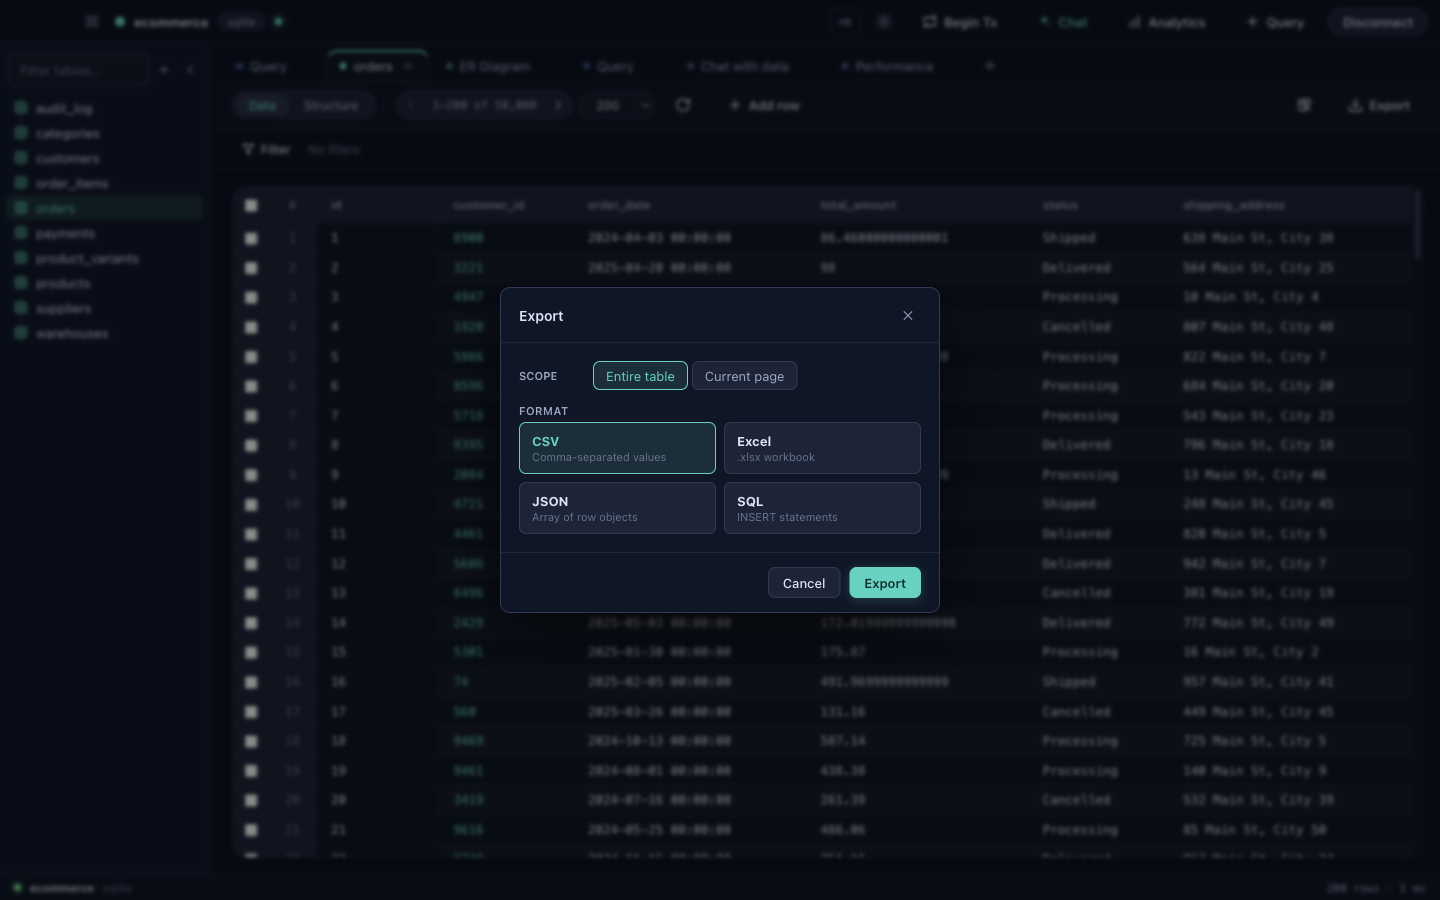
| Format | Use it for |
|---|---|
| CSV | Spreadsheets, quick interchange, importing flat files. |
| Excel | Sharing results with non-technical colleagues. |
| JSON | Feeding data to scripts and APIs. |
| SQL | Portable INSERT scripts and table definitions. |
| Zipped DB dump | A compressed snapshot of a whole database. |
You can also send a query result straight into a new table — handy for materializing a derived dataset.
Data masking
Need a realistic copy of production to develop against — without leaking real customer data? On export, DataDock can anonymize columns with realistic fake data in their place.
- Pick the columns to mask (names, emails, phone numbers, addresses, etc.).
- DataDock substitutes plausible fake values, keeping the data usable for testing.
- The result is safe to copy into a local database or share with the team.
Masking happens on export — your source database is never modified.
Performance & insights
Find and fix the slow parts without leaving the app.
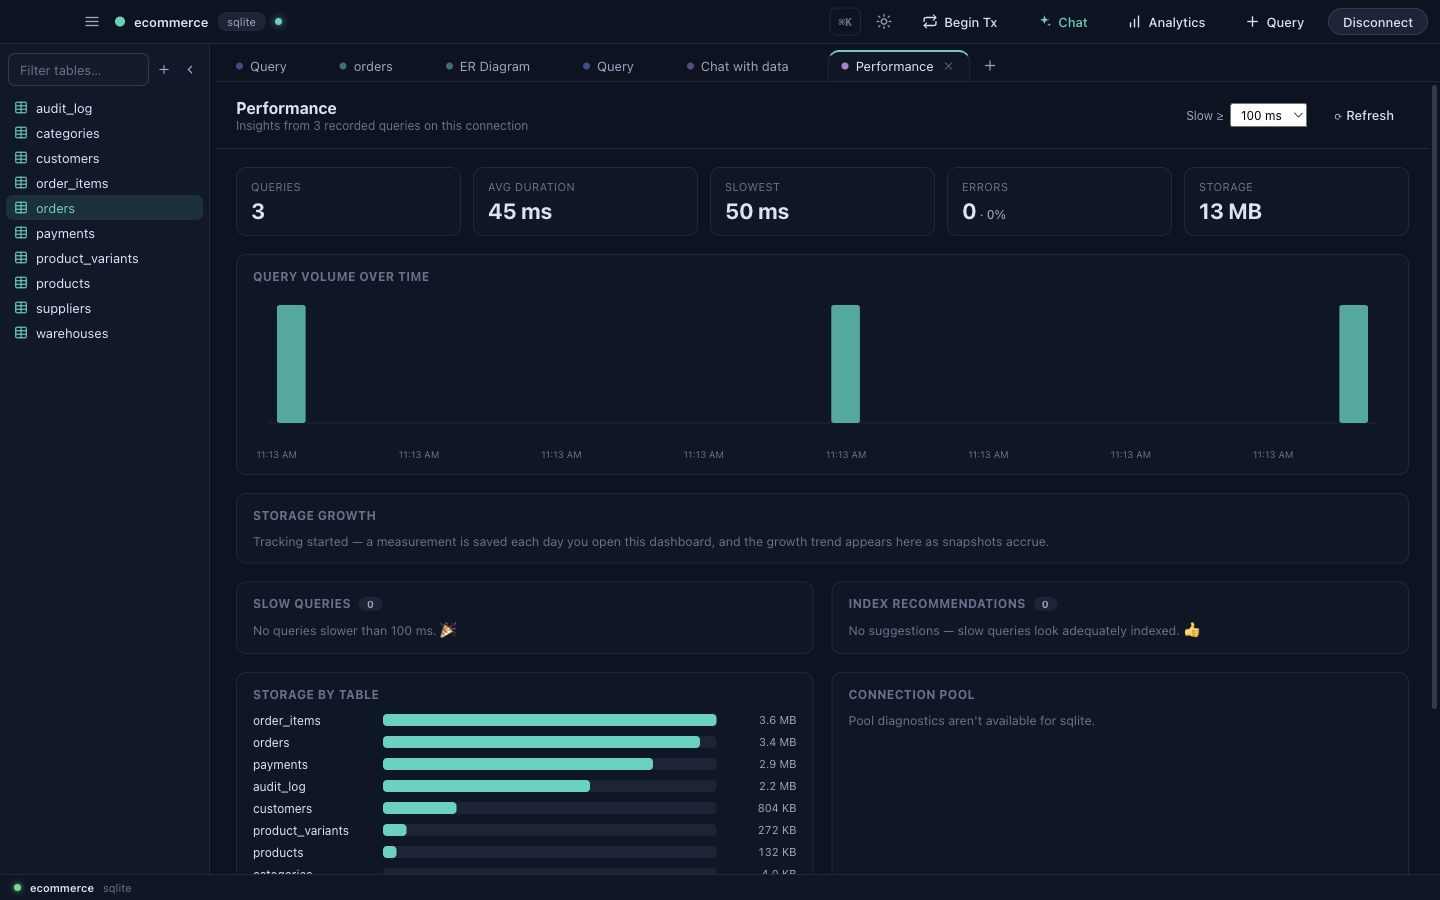
- Slow-query dashboard — see which queries cost the most.
- Index recommendations — suggestions for indexes that would help.
- Pool diagnostics — connection-pool health at a glance.
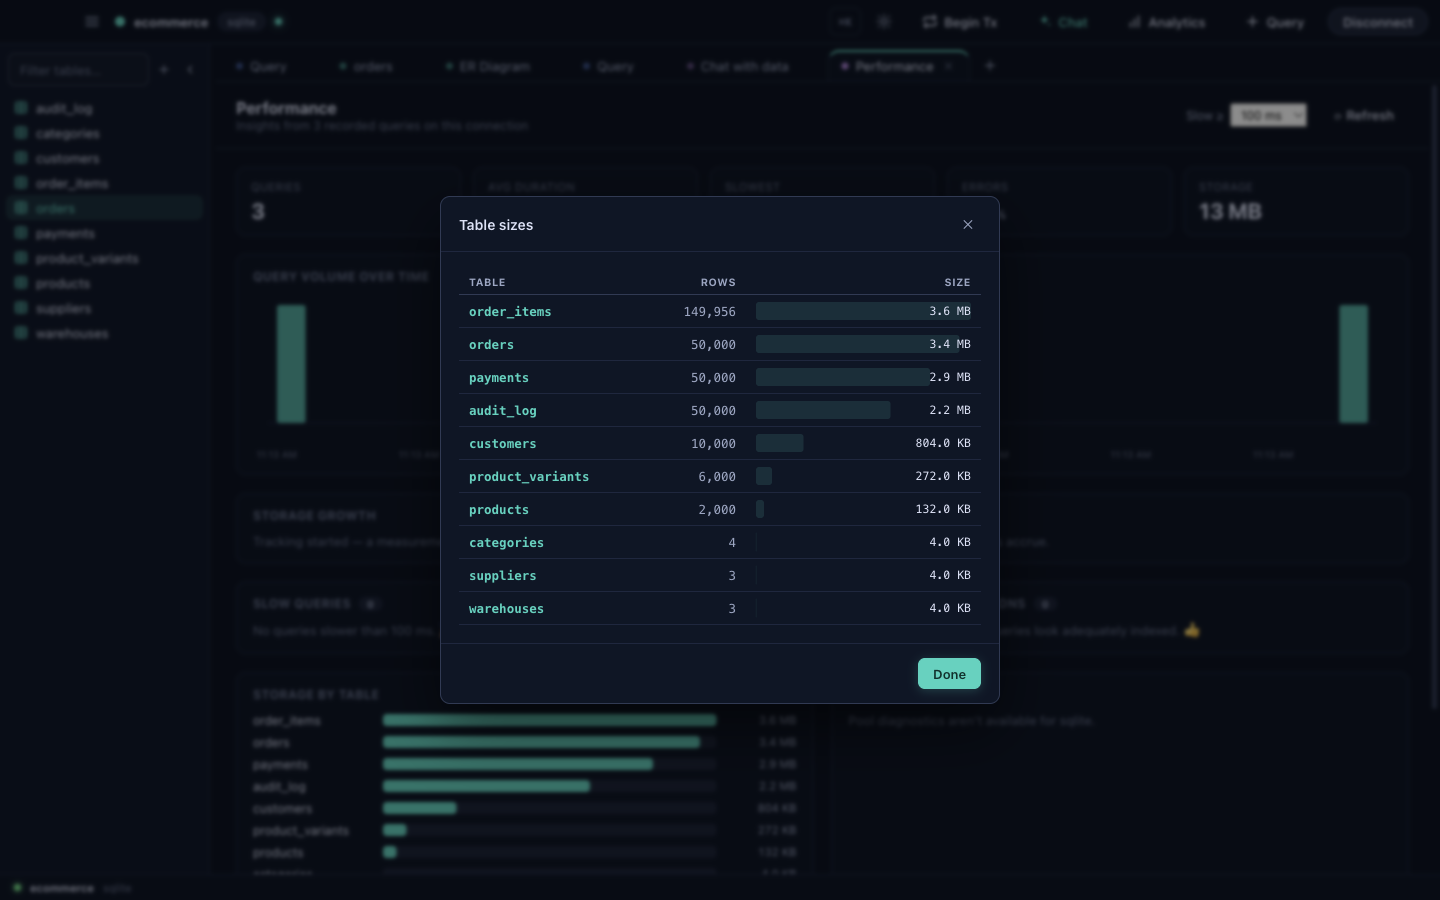
- Table sizes — spot the tables eating your disk.
- Column search — find a column by name across the whole database.
Server tools
Light administration, built in:
- Databases — see and manage the databases on a server.
- Users & roles — review accounts and their privileges.
- Process list — watch active connections and queries, and kill a stuck one.