WORKING WITH DATA
Browsing & editing data
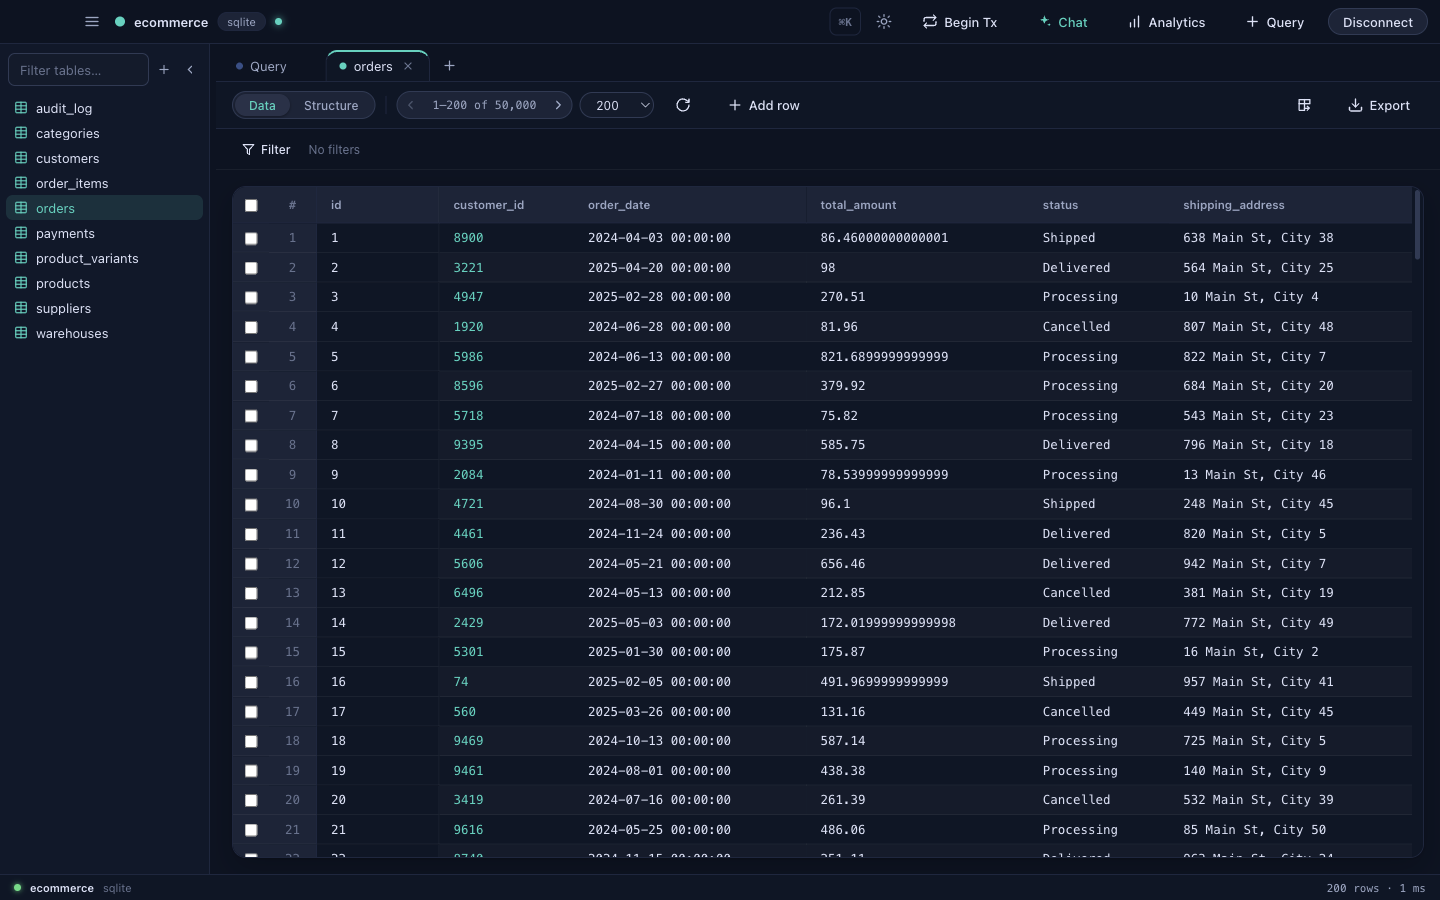
Open any table (or collection) and DataDock loads its rows into a fast, spreadsheet-style data grid. The header shows the row count and how long the query took.
Browse
- Paginate through large tables without loading everything at once.
- Sort by clicking a column header.
- Filter rows with per-column conditions — no SQL required.
- Toggle between the Data and Structure tabs for the same table.
Edit
Editing feels like a spreadsheet, but every change is safe:
- Inline edit a cell by double-clicking it.
- Bulk-edit — set a value across many selected rows at once.
- Add and delete rows from the grid toolbar.
- Changes are staged, then committed in a transaction — a failure rolls the whole batch back. Use Begin Tx to control the transaction yourself.
Visual exploration
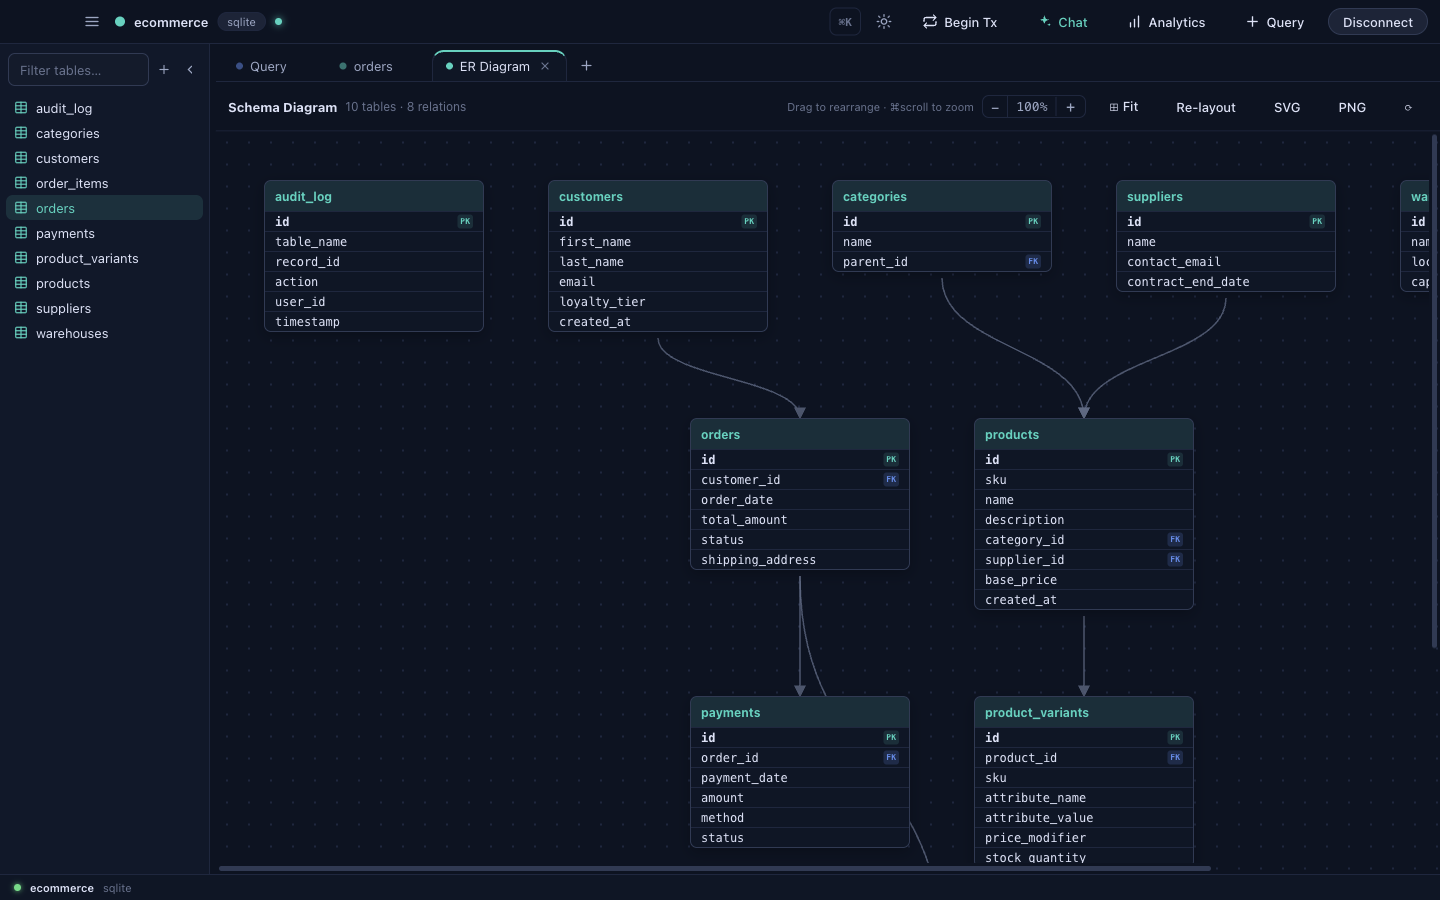
Understanding an unfamiliar schema is half the job. DataDock gives you several ways to see how data fits together.
- Click-through foreign keys — click a foreign-key value to jump to the referenced row.
- Record Explorer — open a single record and walk its relationships outward.
- ER diagram — an interactive map of tables, primary keys and foreign-key links.
- Dependency map — see what depends on what before you change or drop an object.
Find columns fast
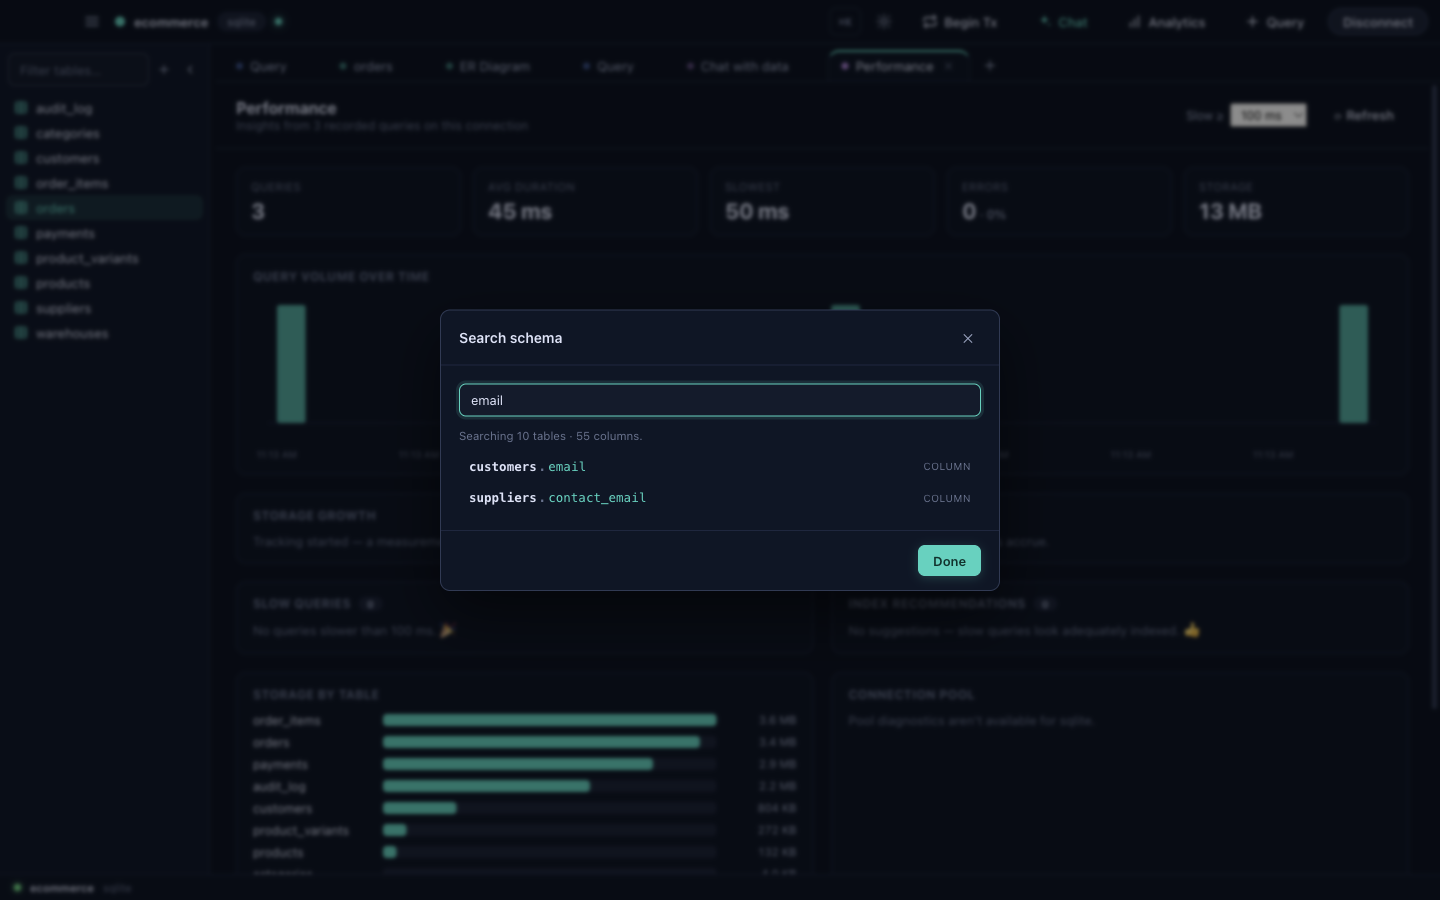
Big schema? Search schema finds any column by name across every table, so you don't have to remember where email lives.
Structure & schema editor
Change your schema without hand-writing DDL. The structure editor turns table design into a form.
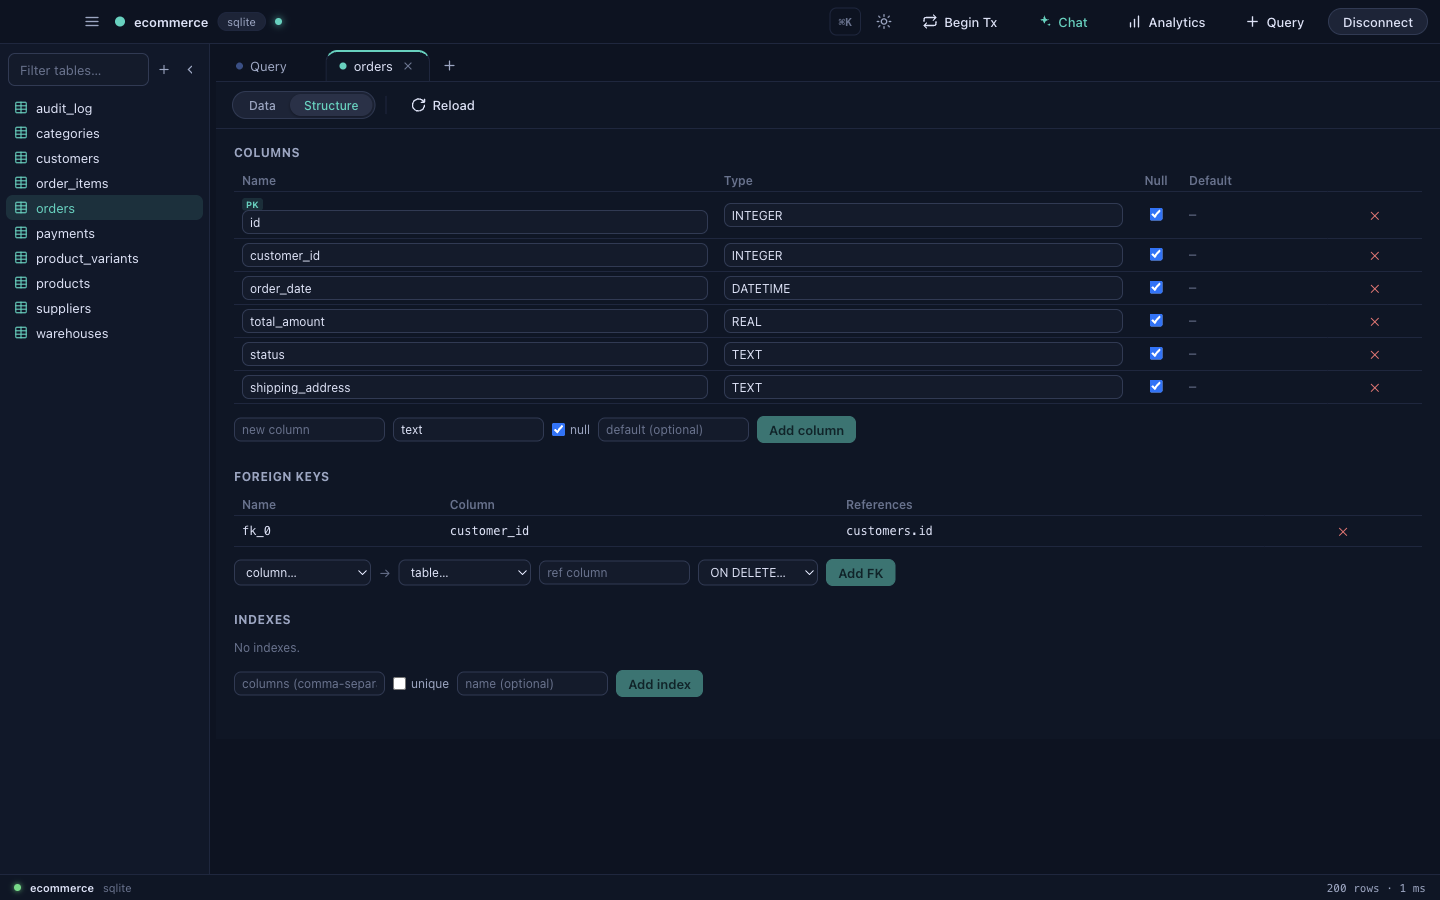
- Create and drop tables from a dialog.
- Edit columns — names, data types, nullability and defaults.
- Manage foreign keys and indexes visually.
- Review the generated SQL before it runs, so nothing happens by surprise.